Stock and ETF Investors
Know when a great company may be a poor place for capital right now.
Free weekly market review every Tuesday, 2 PM ET.
For stock, index, gold, forex and crypto traders who are done guessing and ready to trade what they SEE.
Limited to 25 seats.
Enrollment closes Sun Nov 8 at 11:59 PM ET, or earlier if all 25 seats fill.
Tue Nov 10 and Thu Nov 12, 2026, 2–6 PM ET (live on Zoom)
The Home Study System gives you the complete framework. The Intensive gives you two live days to see the process demonstrated, work through charts, ask questions and correct the mistakes that are difficult to identify on your own.
You learn to read buying and selling flows, supply and demand, Break of Structure, sources, Fair Value Gaps and correlating timeframes directly from price. The goal is a clear process you can understand and repeat.
Know when a great company may be a poor place for capital right now.
Identify clear levels, confirmation and invalidation.
Stop buying the top and holding the bag.
One method. Every market. The ticker doesn’t create the opportunity. The market does.
Watch the Academy overview and excerpts from previous training sessions to see the clarity, interaction and practical market instruction you can expect during the Intensive.
The market is always communicating. This overview explains why learning its language matters for traders, investors and anyone responsible for protecting and growing capital.
Watch excerpts from previous Akeelah Trading Academy sessions and see how complicated market concepts are broken down into a clear, structured learning process.
Each four-hour session has a defined purpose. Day One builds the market-reading foundation. Day Two turns that foundation into a complete decision and execution process.
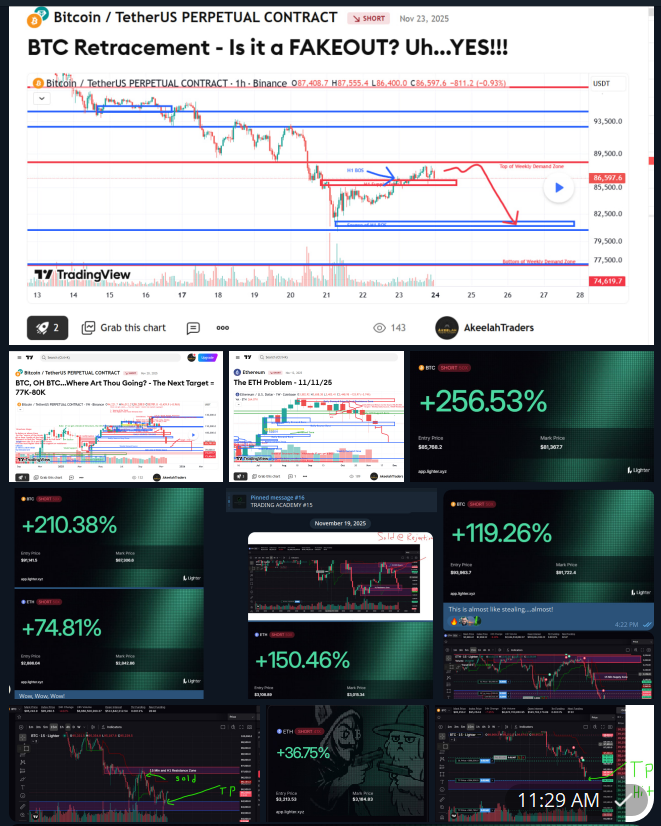
80%+ of our documented analyses reached their projected targets, and we show the ones that didn’t.
Analysis: H1 structure stays bearish unless an H1 candle closes above $45M; target $14.5M–$16M
Result: Target zone reached Oct 22 (about $15M).
Analysis: H4 demand source $91M–$110M; a daily close below $91M invalidates it, next daily demand $15M–$35M
Result: Held for 4 days, then the Oct 22 daily candle closed below $91M. Invalidation posted the same night.
Analysis: Daily break down; daily FVG $340 to $360 below
Result: First downside target reached
Analysis: Daily break down; weekly demand $275 to $302
Result: Weekly demand reached
Analysis: Good earnings, weekly structure still down
Result: Initial downside area reached; larger target active
Analysis: Daily BOS down; 6,850 to 6,950 target
Result: Initial decline, then invalidated
Analysis: Daily break of structure UP; target $4,550 to $4,645
Result: Full upside target reached
Analysis: Three accumulation zones: $400–$408 / $382–$385 / $357–$362
Result: All three zones reached
Analysis: H1 break down; H1 demand source $1,115 to $1,125
Result: H1 and H4 downside targets reached
Analysis: Daily break of structure; 26,920 FVG objective
Result: Major downside move; FVG missed by ~150 points
Analysis: Great earnings, but structure said lower; $195 to $200 daily demand
Result: Daily demand and FVG targets reached
Analysis: First target $1.21 from $1.39
Result: First target reached
Analysis: Weekly target ~$60K demand from ~$89K
Result: ~$59.9K reached 13 days later
Analysis: $610M–$700M from the $900M top
Result: Reached $695M, then fell to $410M.
Analysis: $40M–$50M from $120M–$140M
Result: Reached; trading around $12M later.
Analysis: Exit signal near $100M
Result: Fell through $59M.
Based on Akeelah’s publicly documented analyses (TradingView and X). Some targets were missed or invalidated, and we show those too. Educational only. Not financial advice. Past results do not guarantee future results.
See every analysis on TradingView
“In my view, this is worth more than my engineering degree.”
— Demetrius
These examples show how Akeelah analysis identified market structure before the larger move developed and how the completed outcome validated the original reasoning. Use the controls to review each case study.
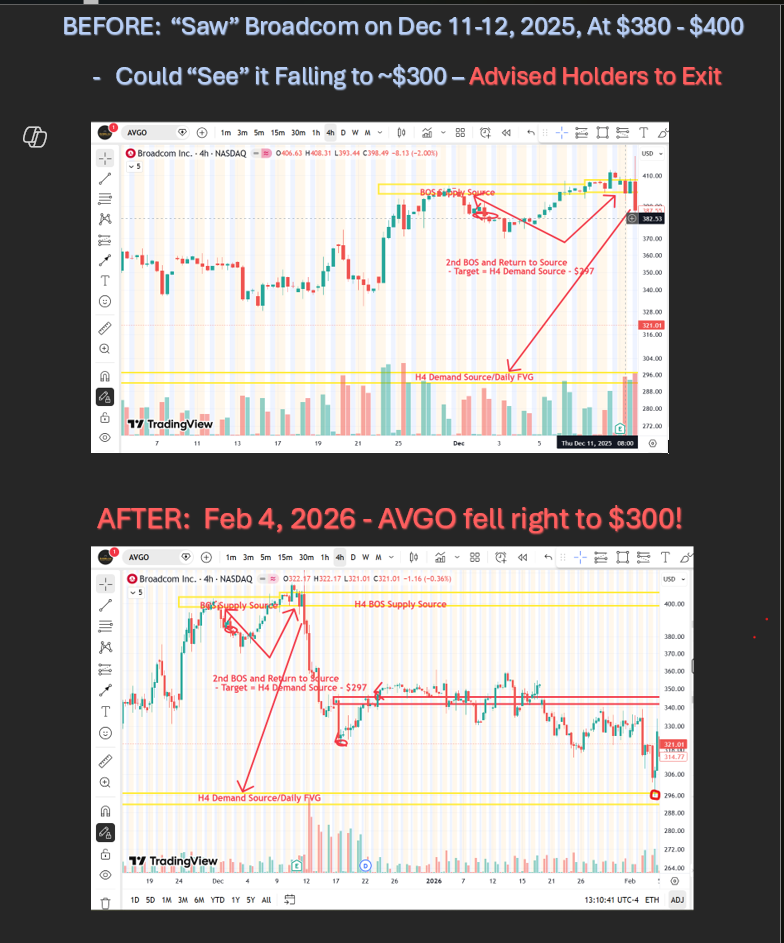
Review the original analysis and the market response that followed. The purpose is not hindsight—it is showing how structure created a plan before price completed the move.
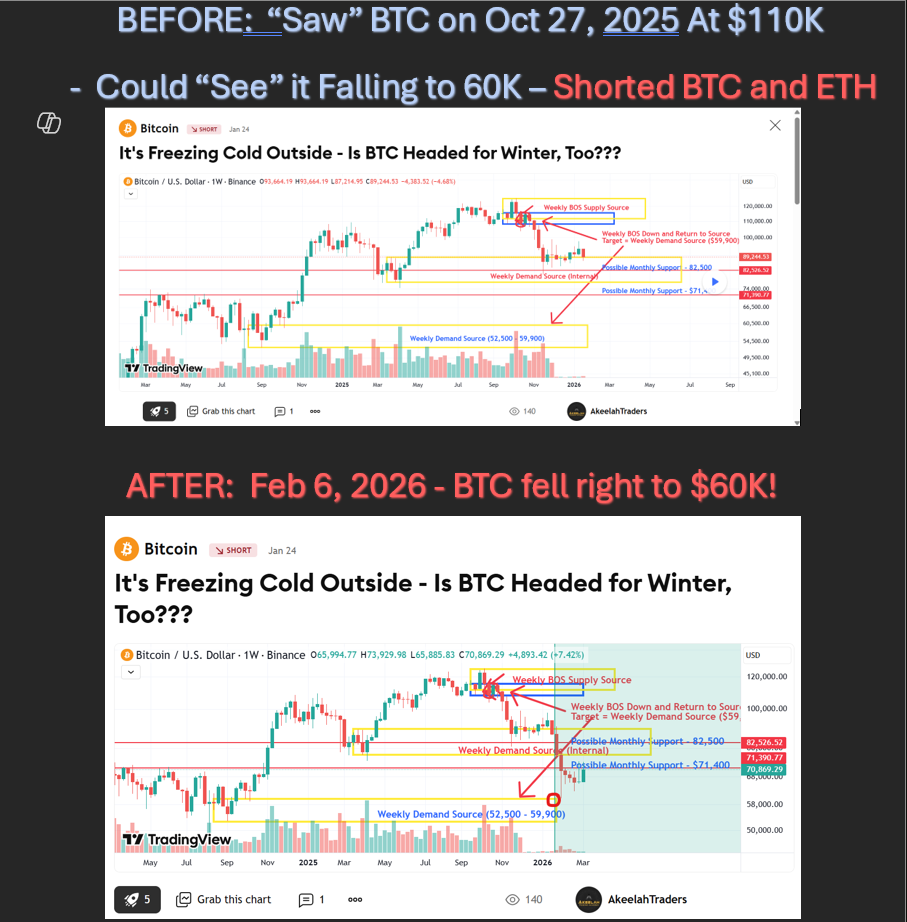
See how identifying the relevant market zones provided a clearer framework for timing, exposure and risk before the completed outcome.
Trading and investing involve risk. These examples are educational and are not promises of future performance.
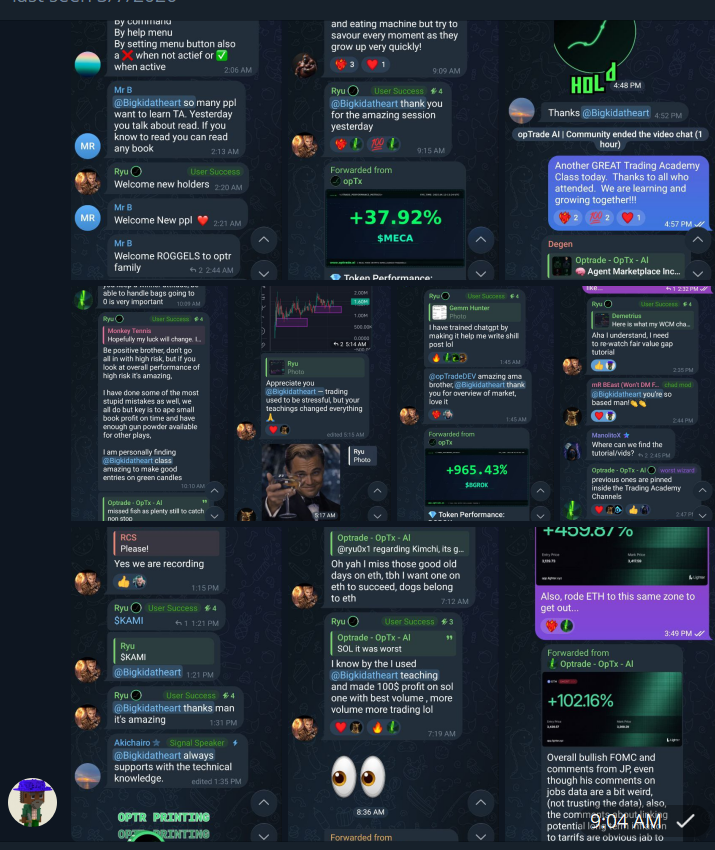
Participant Experiences
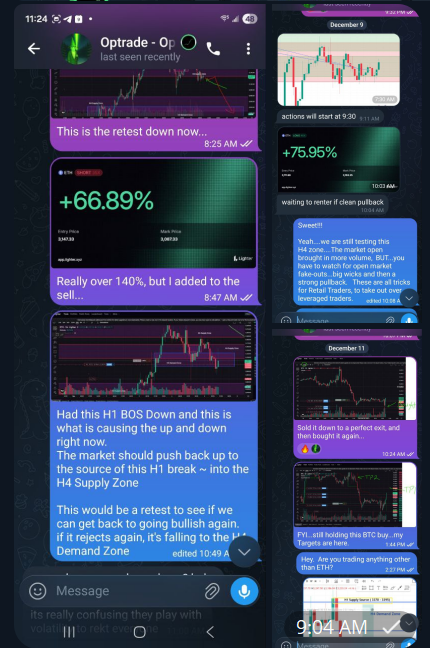
Strategy Application
Trading Development
Market Understanding
“I thought I understood investing and was doing pretty good. After this training, I realized I was guessing most of the time. The structural clarity changed how I view every market.”
Reginald T.Raleigh, NC“No hype and no complicated indicators. It was simple structure. I finally understand when markets shift and what that means—my approach changed completely.”
James R.Atlanta, GA“I never really traded before and just bought what I thought were good stocks. I discovered risk and exposure I did not know I was carrying.”
Danielle K.Houston, TX“I got more understanding from the Trading Academy than years of studying on my own. The framework is clear, practical and immediately applicable.”
Raul W.BrazilYou receive the written methodology and interactive learning environment, then add eight hours of live instruction and application.
Review the complete written methodology before, during and after the live sessions.
Access detailed visual explanations, ask questions, receive instant answers and use audio lessons and interactive podcasts to reinforce the curriculum.
Attend two four-hour sessions with direct teaching, chart walkthroughs, exercises and discussion.
Identify where your structural reading, zone selection or execution logic differs from the Akeelah process.
You are not paying simply for access to a class. You are investing in the complete Home Study System plus two live days of direct instruction, application, questions and correction designed to help you use the methodology correctly.
Paid in full includes the Home Study System ($2,497 value) plus a 30-minute 1:1 chart review with Demetrius.
Or 2 monthly payments of $4,250 ($8,500 total). The second payment is due one month after the first; your plan ends automatically after the second payment.
Or 3 monthly payments of $2,799 ($8,397 total). Your plan ends automatically after the third payment.
Bonus for crypto traders: 3 months of Akeelah FOMO Manager Pro ($597 value). Automated take-profits, stop-losses and trailing stops for fomo.family traders.
Tue Nov 10 and Thu Nov 12, 2026, 2–6 PM ET (live on Zoom).
Session-1 Guarantee: attend the first session. If it isn't worth it to you, tell us before Session 2 starts and get a full refund.
Enrollment closes Sun Nov 8 at 11:59 PM ET, or earlier if all 25 seats fill.
Already own the Home Study System? Your full $2,497 is credited toward the Intensive within 60 days of purchase. Email contact@akeelah.io for your upgrade code.

Demetrius brings a background in Chemical Engineering and certification in Lean Manufacturing to studying the market as a system. Since 2015, he has studied and tested recurring market behavior across more than 3,000 charts to develop the Akeelah methodology.
Meet your mentorTell us what you trade and what you want to improve.
Thanks. Demetrius's team will text or email you within 24 hours to book your 20-minute call.